Accounting offices
Outstanding document requests, work status, approaching due dates, and staff queues.
Dashboards & reporting
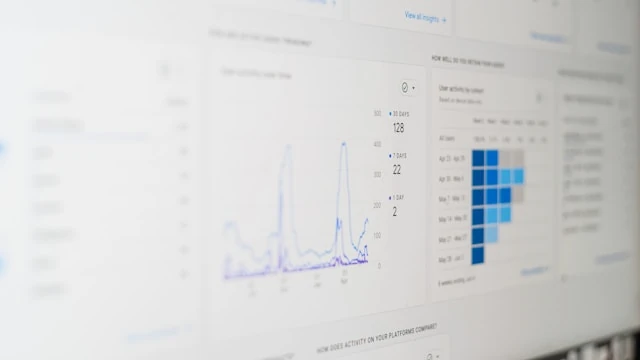
The useful question is not which chart looks best. It is what your team needs to know, how that number is defined, and which decision it should support.
1.Agree the definitions
2.Connect the data
3.Make the next decision
Outstanding document requests, work status, approaching due dates, and staff queues.
Upcoming renewals, unassigned follow-ups, and pipeline stages.
Job stages, outstanding estimates, field updates, and administrative exceptions.
Agreed exports and repeatable reports from authorized sources.
We document the source of each KPI, its calculation, its owner, and its expected refresh schedule. QuickBooks, CRM records, spreadsheets, and exports are evaluated against the actual reporting need.
Start with the meeting, handoff, or decision the report needs to support. An accounting office may need to see which document requests are blocked; an agency may need to see renewals without an assigned owner; a contractor may need to see estimates awaiting follow-up. Each view should make the responsible person, next action, and relevant date understandable—not merely add more charts.
Agree a sample reporting period and compare the proposed output with the source records. Clarify whether cancelled items are excluded, how duplicate records are handled, which timezone defines a day, and whether missing information means zero or unknown. A refresh timestamp and visible failure state help staff distinguish current information from a report that has stopped updating.
The scope covers refresh status, source failures, reconciliation, access permissions, and agreed exports. A dashboard cannot fix missing source data by itself. Extensive cleanup and additional sources are evaluated separately.
Have a different question?
Talk it through with us
They may remain an input or export where that is practical. We agree who maintains them and how changes affect the report.
Only where source systems and the agreed integration support it. Refresh intervals and failure behavior are defined explicitly.
Describe the workflow, report, or system you wish worked better. We’ll tell you whether it makes sense to automate, integrate, or build.